By Jana Ivanidze, MD, PhD,1 Misty Long, ARRT, RT(R)(N),2 Andr├®s Ricaurte-Fajardo, MD,1 Mohammad Raza Khan, MPhys, MSc,2╠²Lady Sawoszczyk, BS, CNMT,2 Brett Muench, BS, ARRT(N)(CT)1
Data and images courtesy of New York-Presbyterian Hospital/Weill Cornell Medical Center, New York, New York, USA.
History
A 76-year-old female presented with memory impairment and was subsequently evaluated for cognitive decline by her primary care physician. Initial workup included 18F-FDG PET/ MRI and MRI brain without contrast, to determine the regional pattern of cortical 18F-FDG avidity as well as to assess for any structural abnormalities, burden of microvascular ischemic change, and cerebral atrophy patterns (Figure 1).
Per standard of care protocol, the patient was administered 7.5 mCi (277.1 MBq) of Fludeoxyglucose F 18 (18F-FDG) Injection3 followed by a 60-minute uptake. Statistical comparison of the 18F-FDG PET data to a database of normal subjects confirmed a disproportionate decrease in 18F-FDG avidity in the bilateral inferolateral parietal cortices, precuneus cortices, and posterior temporal cortices (Figure 2). Further assessment with analysis of cerebrospinal fluid (CSF) AD biomarkers was indeterminate, demonstrating borderline results (A-Beta42: 611 pg/ml, T-Tau: 301.5 pg/ml, P-Tau: 61.3 pg/ml, ATI: 1.03). Quantitative analysis confirmed a disproportionate decrease in 18F-FDG avidity in the bilateral inferolateral parietal cortices, precuneus cortices, and posterior temporal cortices. The patient was referred to a dementia specialist for further evaluation and beta-amyloid PET/CT imaging was performed. Ninety minutes following intravenous (IV) administration of 7.6 mCi (283 MBq) 18F-Florbetaben, the patient underwent PET/CT imaging on Biograph mCT.

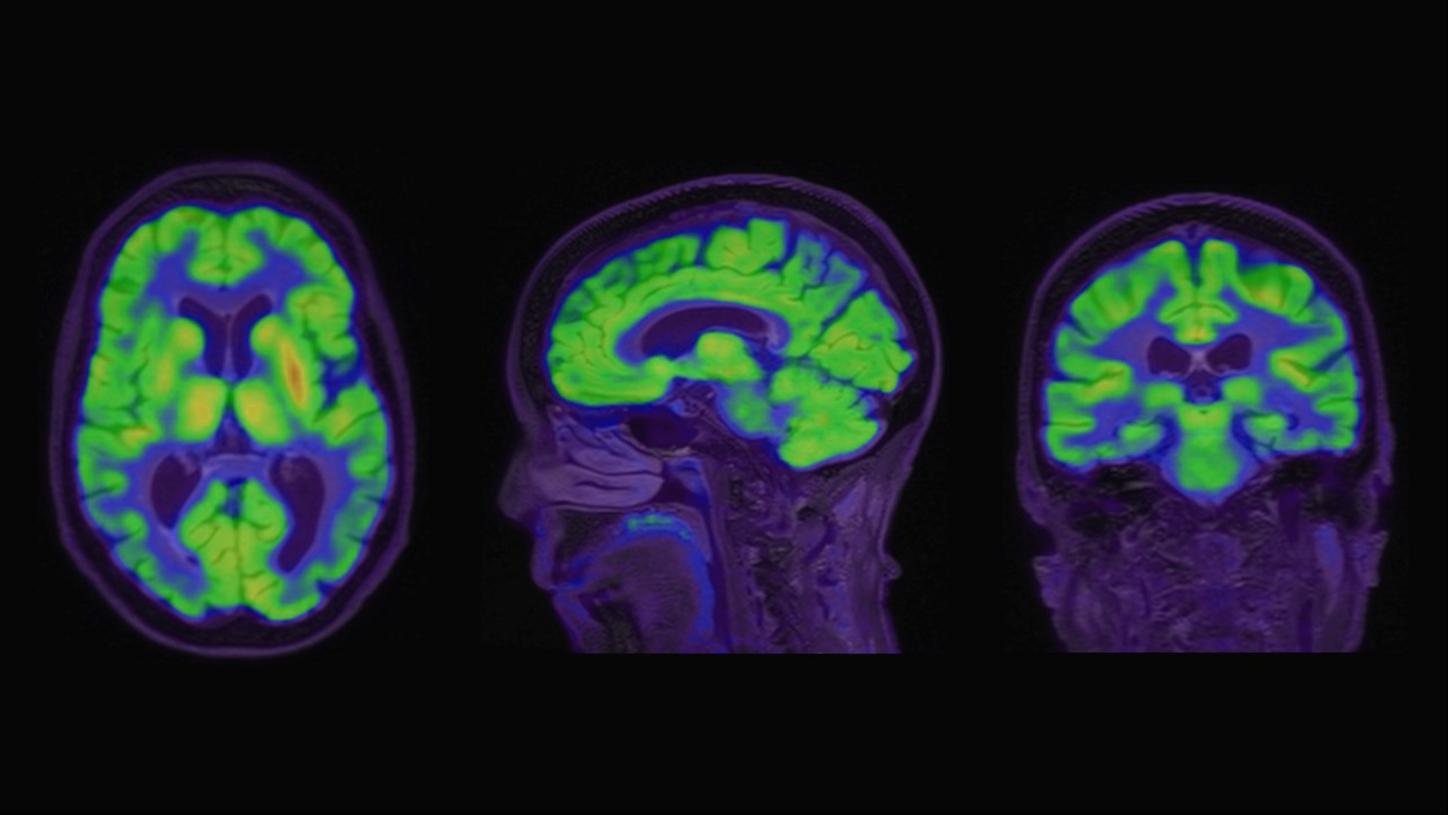
Figure 1: Axial, sagittal, and coronal MRI and PET/MRI images. Top row demonstrates axial, sagittal, and coronal T2FLAIR images; bottom row demonstrates matching attenuation-corrected PET fused to T2 FLAIR series, windowed at maximum SUV 0-10. There is disproportionate decrease in 18F-FDG avidity in the bilateral, inferolateral parietal cortices, precuneus cortices, and posterior temporal cortices.

Findings
18F-Florbetaben PET images in Figure 3 show increased tracer uptake in the entire cerebral gray matter, reflecting increased amyloid deposition with loss of normal gray-white matter contrast. There is diffuse avidity of the radiotracer in the cortical gray matter and white matter, with evidence of markedly increased 18F-Florbetaben avidity throughout the bilateral lateral temporal cortices, frontal cortices, posterior cingulate/precuneus regions, and lateral parietal cortices, relative cortical tracer uptake score of 3 in all regions, compatible with overall brain amyloid plaque load score of 3.
syngo.MI Neuro Cortical Analysis uses the standard uptake ratio (SUVr) as an index of pathologic amyloid deposits in patients with suspected cognitive impairment. SUVr is defined as the ratio between selected cortical regions of interest (ROI), and, in this case, the cerebellar cortex as a reference. Here, syngo.MI Neuro Cortical Analysis demonstrates high global and regional cortico-cerebellar ratio (global SUVr: 2.27), which is significantly higher than the upper level of normal for amyloid burden based on the method by Barthel et al (Figure 4). The method is based on a multi-center trial which demonstrated a threshold of greater than or equal to 1.57 SUVr, reflects pathological levels of amyloid accumulation associated with AlzheimerŌĆÖs disease (AD).4 In addition, the Centiloid (CL) score is 152.6, reflecting a high cortical beta-amyloid burden.╠²
Siemens Healthineers offers quantitative software on syngo.via for the accurate localization of cortical beta-amyloid distribution and quantification of brain PET images. syngo.MI Neuro DB Comparison enables physicians to compare the patientŌĆÖs cortical beta-amyloid distribution with a normal reference database and determine region-specific z-scores in a heat map as shown in Figure 5. Additionally, syngo.MI Neuro Cortical Analysis enables the calculation of corticocerebellar SUVr. Furthermore, the CL method allows standardized evaluation of beta-amyloid PET results, which has demonstrated utility in prospective therapeutic clinical trials.5 The CL scale is referenced from 0 to 100, where the 0 CL represents young healthy amyloid-negative controls, and the 100 CL represents amyloid-positive patients with confirmed diagnosis of AD. However, scores can fall above or below 0-100 range. These quantitative metrics of beta-amyloid PET are likely to be incorporated in clinical reports in the near future. MRI fusion, normalization to a standard reference template, and the ability to create a custom normal database further enhance syngo.MI NeurologyŌĆÖs capabilities. A robust solution for both visual interpretation and quantification, adding further reader confidence to a clinical read.╠²
Subsequent apolipoprotein E (APOE) gene testing revealed the patient to be a carrier of the APOE4 allele and APOE3 allele genotype, which is associated with an increased risk of AD. Positive confirmation of beta-amyloid burden derived from 18F-Florbetaben PET/CT imaging made the patient eligible for anti-amyloid monoclonal antibody treatment using Lecanumab. As a requirement for therapy monitoring, MRI was obtained to evaluate for Amyloid Related Imaging Abnormalities (ARIA). While most adverse events are asymptomatic, carriers of APOE4 are at higher risk for ARIA. In this patient, baseline MRI demonstrated no acute abnormalities; there was a mild burden of chronic microvascular ischemic changes and no evidence of chronic microhemorrhages. After initiation of Lecanemab therapy, subsequent surveillance MRI revealed no interval change, including no evidence of ARIA-H (microhemorrhages) or ARIA-E (edema), allowing the patient to proceed with subsequent therapeutic doses of Lecanemab for the treatment of AD as per standard of care.

Figure 3: Axial 18F-Florbetaben beta-amyloid PET images show increased tracer uptake throughout the entire cerebral gray matter, including the bilateral lateral temporal cortices, frontal cortices, posterior cingulate/precuneus regions, and lateral parietal cortices, with loss of normal gray-white matter differentiation, reflecting diffuse cortical beta-amyloid deposition.


Discussion
Molecular imaging is a key component in the management of patients with suspected AD. Specifically, brain PET imaging with 18F-FDG allows visualization of altered patterns of cortical metabolism, thereby providing important differential diagnostic considerations. Amyloid-targeted PET allows visualization of cortical beta-amyloid distribution, and thereby, provides an estimate of beta-amyloid neuritic plaque density in patients with cognitive impairment who are being evaluated for AD and other causes of cognitive decline.6 Most notably, confirmation of presence of beta-amyloid pathology prior to initiating treatment is required by the label to qualify for anti-amyloid monoclonal antibody treatment in patients with mild cognitive impairment (MCI) or mild dementia stage of AD.5 Currently, there are two approaches available for the evaluation of cortical beta-amyloid plaque burden: CSF analysis via lumbar puncture, also known as a spinal tap, and beta-amyloid PET imaging. Importantly, compared to lumbar puncture, PET imaging is minimally invasive to the patient.╠²
Along with the visual interpretation, PET imaging allows quantitative assessment of the geographic distribution of cortical beta-amyloid plaque deposition. Both SUVr and CL scale assessments are widely adopted in current amyloid PET studies, including anti-amyloid therapy trials and FDA-approved therapies.5 In addition to current standard clinical practice interpretation of a positive or negative scan, gray versus white matter visual assessment, quantitative evaluation using database comparison, corticocerebellar SUVr, and CL scale has the potential of optimizing patient selection and monitoring for amyloid-targeted therapy.